KEY PERFORMING INDICATORS
Report for FY 2015-2021
INTRODUCTION
The following data is a compilation of data provided by the Pacific Power Utilities annual Benchmarking Reports for Marshalls Energy Company for the Fiscal Year 2015 to 2021. As one can notice, certain years have no data, thus left blank, (2019).
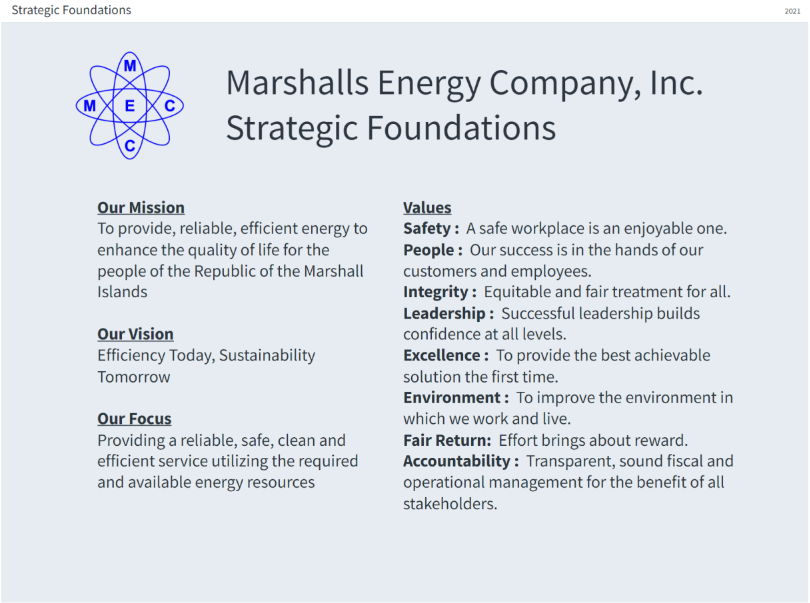
As can be seen in MEC’s strategic foundations, MEC’s mission is to provide reliable, efficient energy to enhance the quality of life for the people of the Republic of the Marshall Islands.
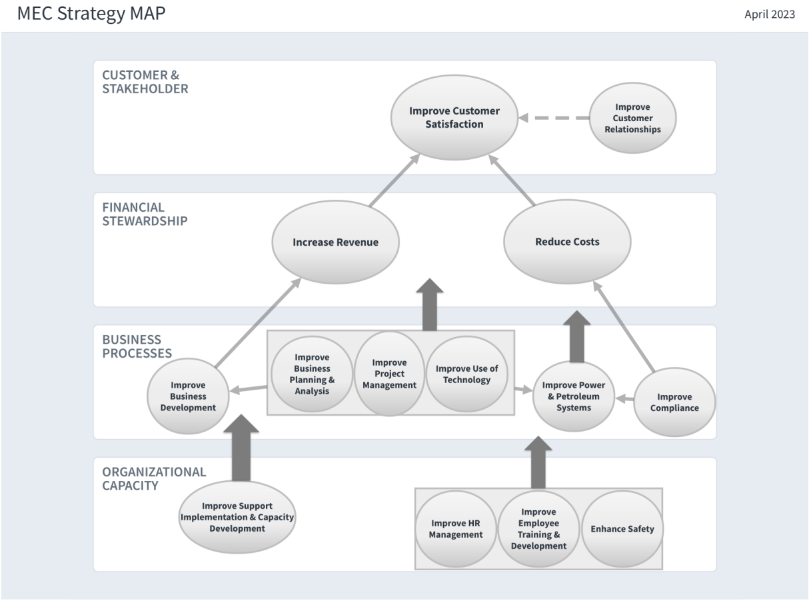
MEC’s strategic map, as illustrated above, shows MEC’s priority areas that recognizes organizational capacity will enable business processes and financial stewardship which will enable for customer and stakeholder satisfaction.

As can be seen in the table above, MEC is a Medium size utility with a Peak Demand of 9.8 MW, with a total annual energy of 63,857 MWH, and a RE contribution of 1%.

The above data collected comes from paper written hourly log sheets completed by the power plant operators, engineers, and administration team. The collected data is entered in spreadsheets and processed into the charts and tables herein. The above bar chart represents Majuro’s Total MWh generated per year from 2013 till 2020. One can notice a slight increase from 2016 to 2017 to 2020. Also, each line represents breakdown by feeder. Feeder 2 has the highest MWh, serving a larger population, then comes Feeder 1 , and Feeder 3.
1. GOVERNANCE INDICATOR
1.1 Key Governance Results
The composite governance score introduced in the 2012 Fiscal Year Report has again been utilised in each year’s power benchmarking exercise for the purpose of analysing if good governance mechanisms are delivering tangible benefits to utilities in the form of improved financial performance. The composite score is comprised of the same weighted indicators as the 2012 Fiscal Year Report, determined from relevant responses in the governance questionnaire using a governance scorecard (See table below).
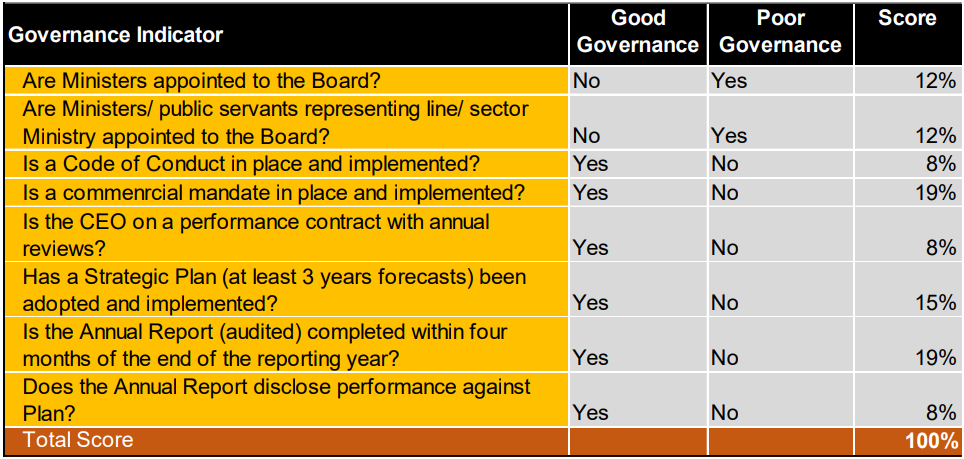
Note: A good governance score results in full marks for each indicator, whilst a poor governance result receives a zero for each applicable indicator. In regard to the indicator on Annual Reports being completed within four months of the end of the reporting year, this has been used as a good practice standard, but it is acknowledged that several utilities have agreements with their regulators that allow for longer periods for production of Annual Reports.
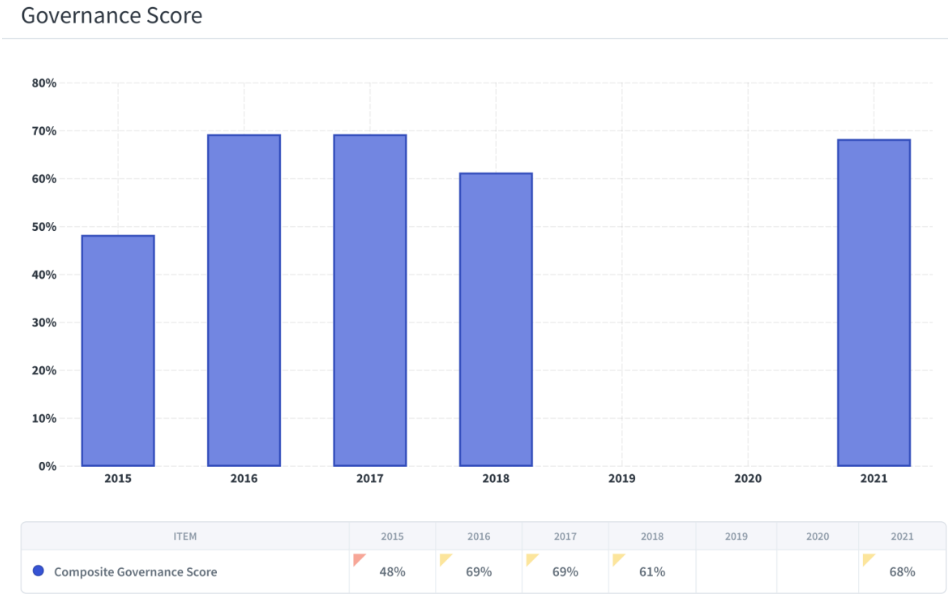
The table below shows Governance scores for MEC from 2015 to 2021. One can notice an increase in governance score in 2021.
2. DATA RELIABILITY
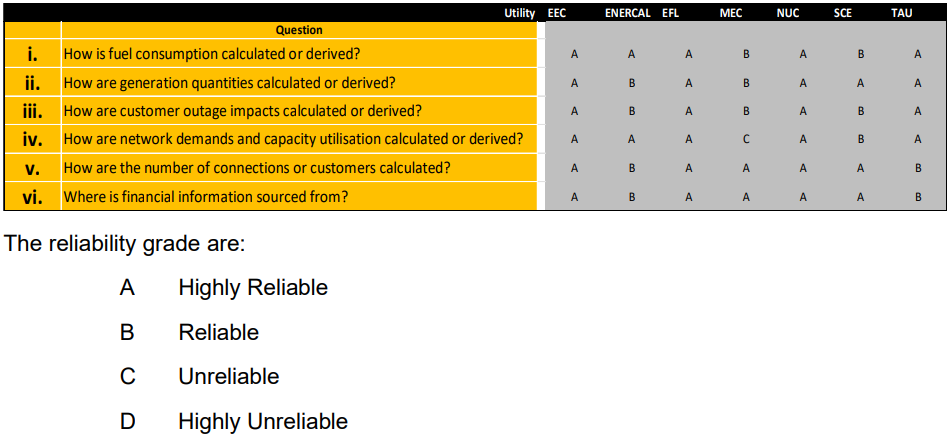
Figure 4.2 presents the data reliability category as assess by the utilities that responded. These are translated into aggregate reliability scores submitted by each of the utilities in order to rank the relative reliability of the data that was submitted. These aggregate scores have furthermore been utilised as a weighting in this reporting in calculating the Composite Indicator for each year.
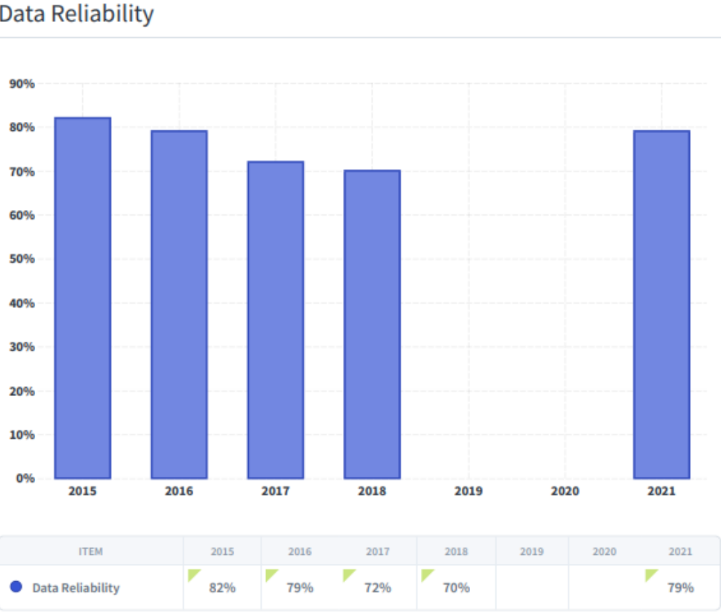
Data reliability for each year’s data submitted by MEC to PPA were as in table above.
3. KPI RESULTS
3.1 Introduction
This section provides performance results for the 2015 FY to 2021 FY. The results are comprised of several KPIs, with each indicator graphically presented.
3.2 GENERATION INDICATORS
3.2.1 Load Factor
The Load Factor (LF) is the average load demand divided by the peak demand over a period. In this report the period is the fiscal year and the LF is given for each electricity grid operated by the utility. The LF is an indicator of the utilization of production capacity. Production capacity is maintained to provide for peak demand. A lower LF indicates a load profile with a greater peak compared to the average load and a lower utilization of production capacity. A high LF implies a relatively flat demand profile and higher capacity utilization. This generally indicates an efficient use of production resources. However, a high LF could result from limiting peak demand by regular load shedding due to insufficient reliable production capacity. In this instance the high LF does not indicate an improved performance but is rather a symptom of insufficient reliable production capacity to meet the demand. The minimum LF
deemed acceptable is 50% while a benchmark of 80% is set for Pacific Island Utilities. Demand side management strategies, time of use tariffs, peak lopping and demand shifting strategies can be adopted to limit the peak demand and improve the LF. This is expected to be an increasingly important activity in Pacific power sector policies.
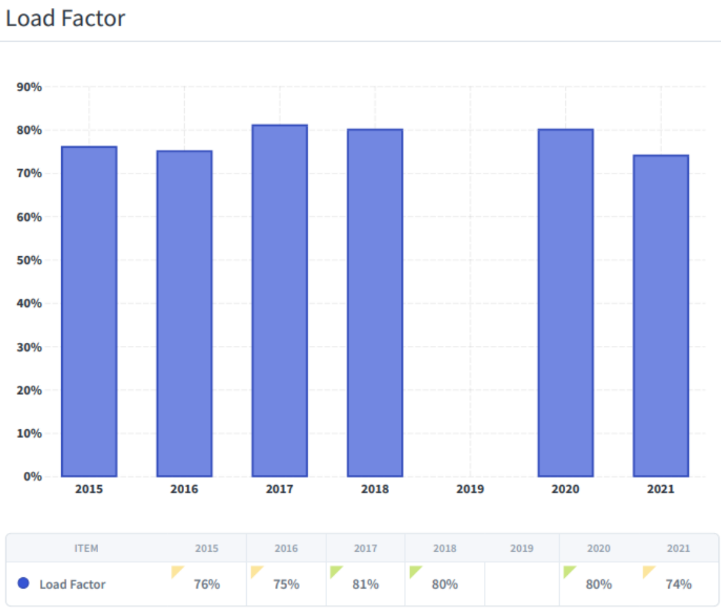
MEC’s load factors for years 2017 to 2020 were above the benchmark of 80%.
3.2.2 Capacity Factor
Capacity factor (CF) is also an indicator of effectiveness in relation to the use of generation resources. It is a similar measure to LF. Where LF measures average power as a percentage of maximum demand, CF measures average power demand as a percentage of installed firm capacity. The lower the CF the greater the production reserve capacity available to provide for demand when production units are taken out of service for maintenance purposes or for repairs due to faults. It also may suggest over investment in production capacity which situation is best avoided. A higher CF indicates a peak demand that approaches available production capacity. This may cause difficulties in scheduling maintenance for the generating plants and may result in load shedding during peak load periods when generators are taken out of service due to faults. The investment in production capacity is determine by the power
security policy adopted by the utility. Utilities may adopt a security policy of N-1 or N-2. N-1 production capacity is the maintenance of sufficient production capacity to cater for the loss of the generating unit with the largest capacity in the fleet. Likewise, N-2 caters for the loss of the two largest units in the fleet. The minimum production capacity is determined by the power security policy adopted based on experience concerning reliability, the cost of investment and expectations regarding the lifespan of the firm production equipment. Installing more capacity than required would be an inefficient way of utilising a utilities financial resources, while, underinvesting may compromise the reliability of power supply.
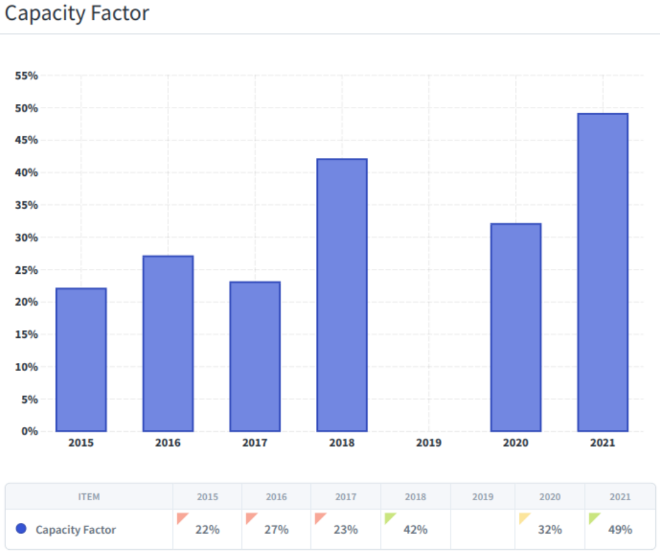
Too high a CF, risk having insufficient capacity to meet demand at all times
A low CF indicates over investment in capacity.
Pacific Benchmark >40%
MEC’s CF for 2018 and 2021 were above the benchmark of 40%.
3.2.3 Generation Labour Productivity
Generation Labour Productivity (GPL) is a measure of the total energy produced per full-time equivalent (FTEG). Benchmarking of GPL for comparable utilities in size, demand and generation asset types would indicate whether the utility production team is right sized. The average GPL for 2021 is 1.89 GWH. For
2020 the average was 1.3 GWH. The GLP for 2020 and 2021 is not comparable for the 2020 data did not include the GLP for GPA and EFL. GPA and EFL are the larger utilities in the PPA and as expected they have a higher GLP than the smaller utilities and so have lifted up the average.
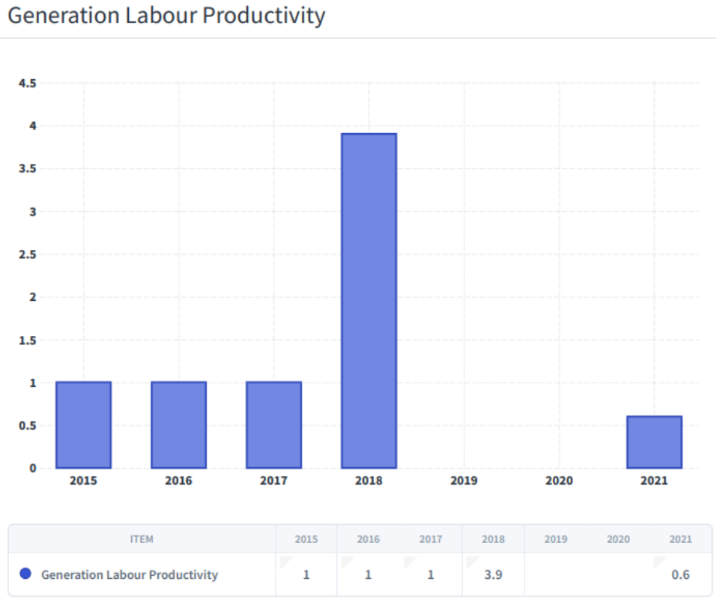
MEC’s GLP are shown in the above graph.
3.2.4 Specific Fuel Consumption DFO (kwh/Litre)
Specific fuel consumption (SFC) is a measure of the efficiency of fuel used for power generation utilizing diesel fired power generators, and is often reported in kWh/litre, kg/kWh or kWh/gallon. It is a critical performance indicator because fuel costs accounts for the bulk of generation expenses in a typical diesel-based power utility. Importantly, SFC refers to the efficiency of utility fossil fuel generation only – it does not include purchased energy from Independent Power Producers (IPPs). Furthermore, non diesel generation is not factored into this indicator. As power utilities transition away from fossil fuel based production of power to renewable resources, and more IPPs are engaged in the production of energy, the impact of fossil fuel will factor less in the overall efficiency and costs of energy production.
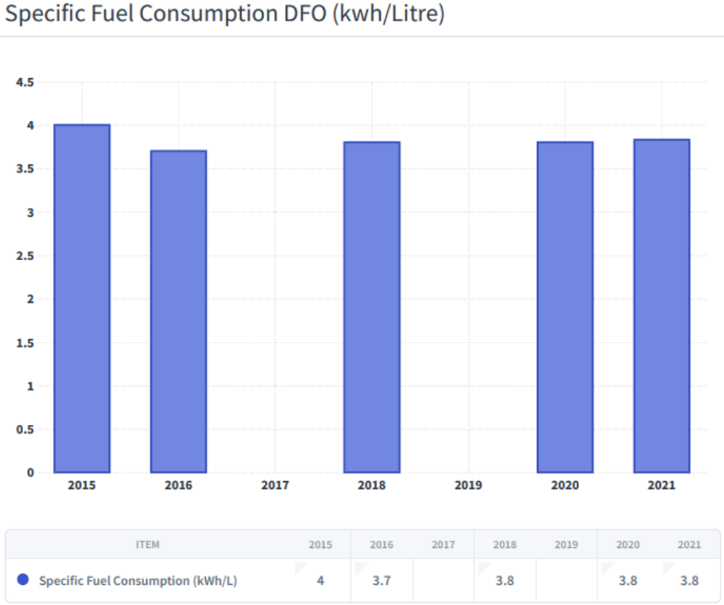
The Benchmark for SFC is 4 kWh per litre. The lower the indicator the less efficient the operation of the diesel generator.
MEC’s SFC was at 4 kWh in 2015 and maintained at just below the benchmark of 4 kWh for subsequent years.
3.2.5 Specific Lubricating Oil Consumption
Specific Lubricating Oil Consumption (SLOC) is a measure of lubricating oil efficiency of usage by the diesel and HFO generating units and is determined by the number of kWh generated per litre of lubricating oil consumed. The benchmark varies according to the size and condition of the diesel engine. Lower lubricating oil efficiency can be attributed to poor maintenance, e.g. due to worn piston rings or leaks in the system. Reasonable values are about 500–700 kWh per litre for a 1 MW engine and 1,000– 1,300 kWh per litre for a 4–5 MW engine. SLOC much like the SFC will become less important as an indicator as the contribution to the energy produced is increased from renewable sources, especially from solar PV power plants.
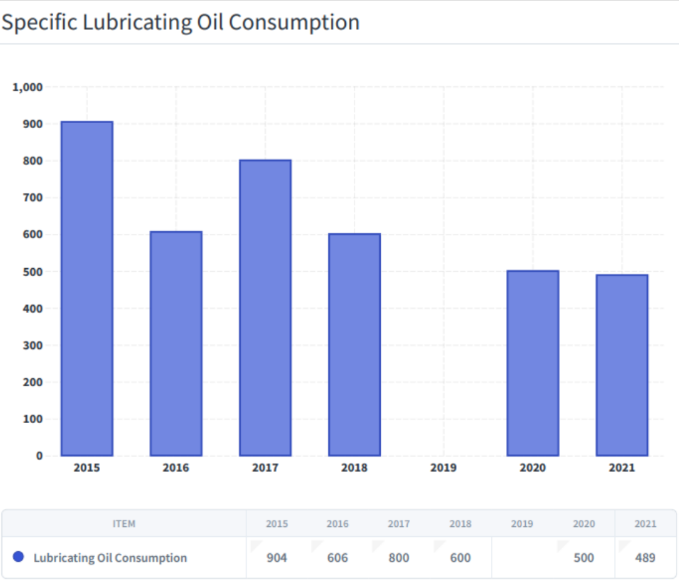
Lubricating oil consumption for MEC has decreased over the years from 904 to 489.
3.2.6 Forced Outage
A forced outage is an unplanned outage (or generator downtime) that has been forced on the utility. Unplanned outages are attributable to issues with generators that compelled the utility to take them out of service. In 2021, 9 utilities provided sufficient data for 18 grids. The average forced outage indicator for the 18 power grids is 0.3%. The Pacific benchmark is less than 3%.
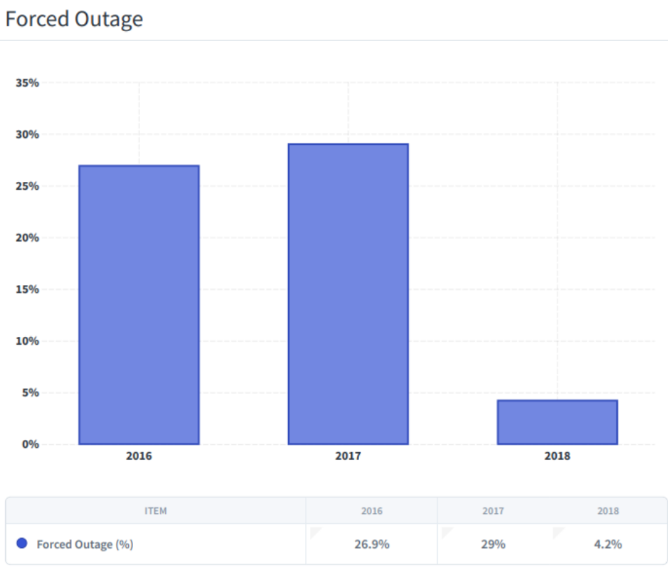
MEC’s forced outage has decreased considerably from 26.9% to 4.2% from 2016 to 2018.
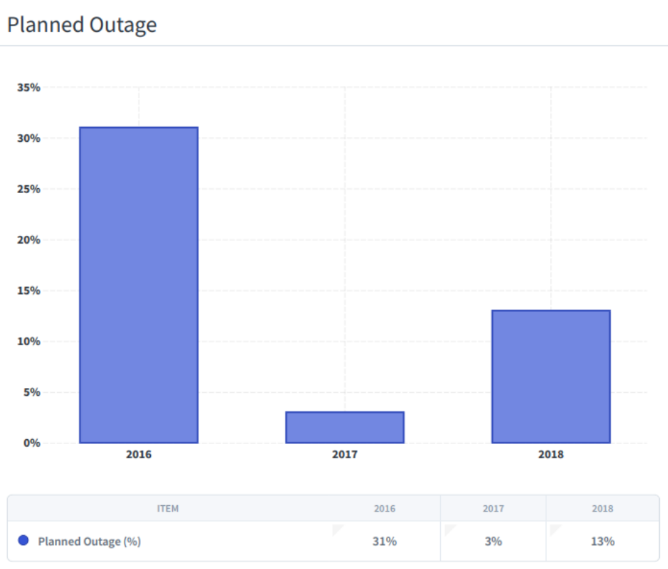
3.2.7 Planned Outage
Planned or scheduled outages measure the proportion of downtime for planned maintenance activities that require the plant to be shut down. It is a scheduled loss of generating capacity as a percentage of installed capacity to generate energy. Planned maintenance of generating equipment is often compromised in Pacific Island utilities.
Some reasons for this are; (1) insufficient firm reserve capacity to allow the extended shutdown of generators due for scheduled maintenance, (2) a lack of spare parts in store leading to long downtimes awaiting for delivery of spares, and (3) lack of funds for major contracted service work. When the intervals between maintenance are extended, the probability that generators will break down increases. The Pacific benchmark is below 3%. An indicator that is too low may indicate the lack of scheduled maintenance which if so would eventually result in a higher than expected force outage indicator.
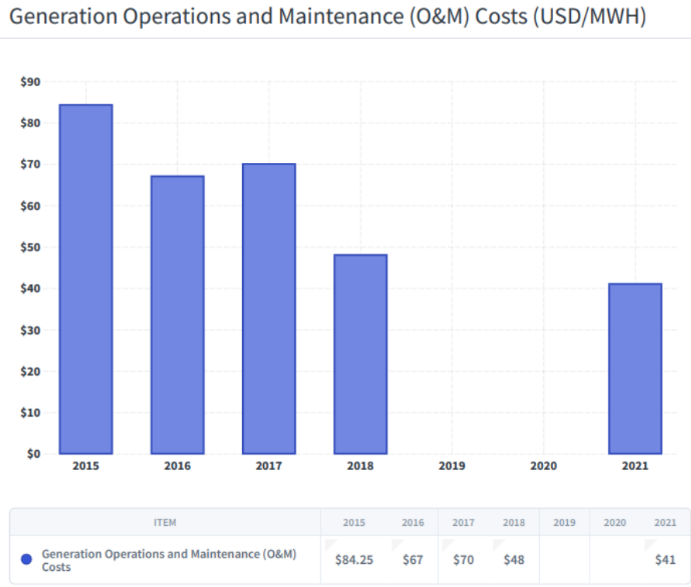
3.2.8 Generation Operations and Maintenance (O&M) Costs
The indicator used is the expenditure on O&M for generating equipment per MWh generated, expressed in USD.
3.2.9 Power Station Usage
This indicator measures the usage of power in % by the power station to generate electricity. Below 5% is considered acceptable, and lower it is the better.

3.3 DISTRIBUTION INDICATORS
3.3.1 Network Delivery Losses
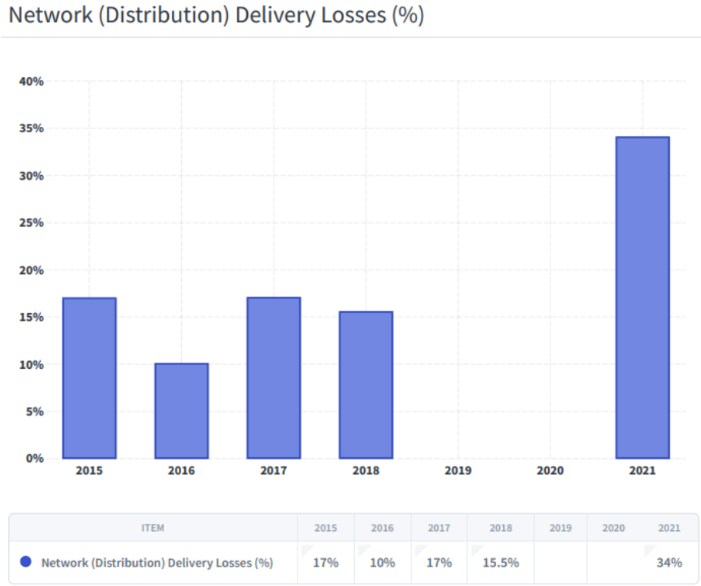
Network delivery losses are defined as the net generation minus electricity sold, divided by net generation, and expressed as a percentage. Net Generation is energy generated less the power station auxiliary usage. For utilities that have a transmission network, this loss includes the transmission and distribution network losses. This is only true for utility members of the PPA who have transmission network. For the other utility members who do not have a transmission network the Network Delivery Losses is equal to the Distribution Losses. Therefore, in this report the Distribution loss is not presented separately as in previous reports. The losses comprise technical and non-technical losses. Technical losses are mainly caused resistance in the network lines and cables which may be exacerbated by imbalances in the currents for each phase and high resistance joints in the distribution system. These depend on distribution voltages, loading, conductor material, physical dimensions and state of conductors. Non-technical losses are those attributable to electricity used by a consumer but not paid for, including electricity theft, meter reading and accounting errors, unmetered connections, metering errors, etc. This category should not include the use of electricity within the utility itself (other facility use), free provision for street lighting, or electricity provided to the water and sewerage waste management for utilities that are responsible for electricity, water and sewerage services. Inclusive of transmission loss this indicator should be below 10% for power grids that have transmission systems while for the smaller utilities this should be below 5%.
As can be seen in the graph above, MEC’s Network Losses is very high, well above the 10% benchmark.
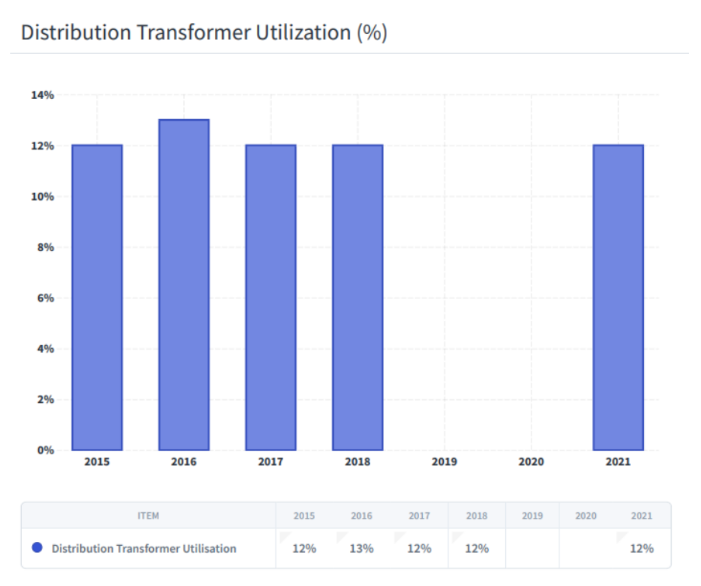
3.3.2 Distribution Transformer Utilization
This indicator measures the transformer average load against the transformer capacity in megavolt amperes (MVA). It is calculated by dividing the total electricity sold by the total capacity of distribution transformers. High utilisation implies an efficient capital expenditure process for investing in distribution transformer capacity to meet the demands of customers. This process takes into consideration non coincident demand characteristics, demand growth and contingency requirements to maintain supply security and reliability. Transformer utilisation in Pacific utilities is low. In 2002 a regional goal of 30% was set.
The report noted that “this can only be achieved in the long term because of the long lead times required to improve usage of capital assets. For 2021 the range for TUF is 7% to 54%. The Benchmark is 30%. It appears that the situation has not improved.
3.3.3. Distribution Reliability
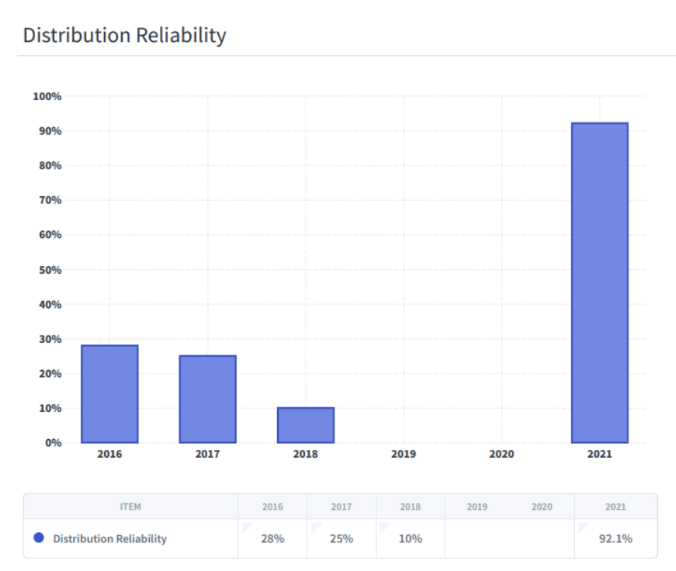
This indicator looks at forced outage events per 100km of distribution line as a way of measuring the reliability of the distribution network. The average for FY 2021 is 21 events per 100 KM of distribution lines. The average for the utilities that report for the year 2020 was 29.
Ongoing maintenance to preserve the condition of infrastructure is key to improving reliability and customer service. The number of planned outage events reflect the maintenance carried out on the distribution network.
3.3.4 Customers per Distribution Employee
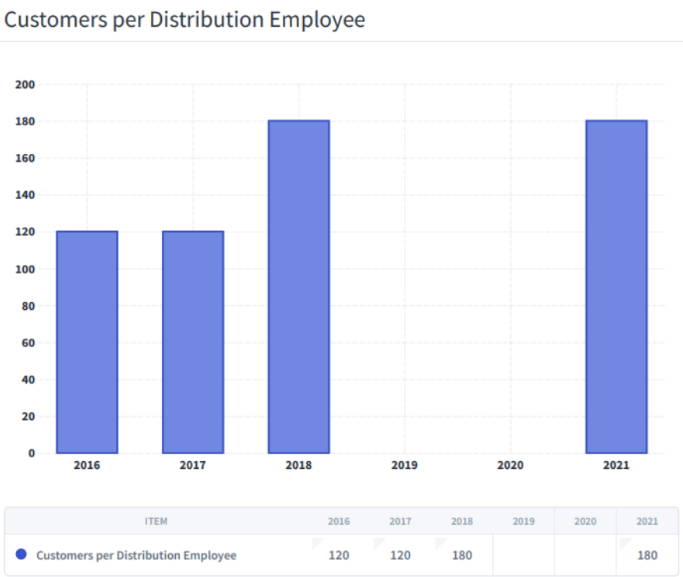
The number of customers per distribution employee full time equivalent is another indicator of labour productivity
3.3.5 Distribution O & M Expenses
The Distribution Operations and Maintenance O&M costs is the total expenses incurred in the operations and maintenance of the distribution network, in USD. This includes all vehicle operating costs and all other costs related to distribution operations. This total O&M cost is divided by the distribution line length.

3.4 SAIDI and SAIFI
3.4.1 System Average Interruption Duration Index (SAIDI)
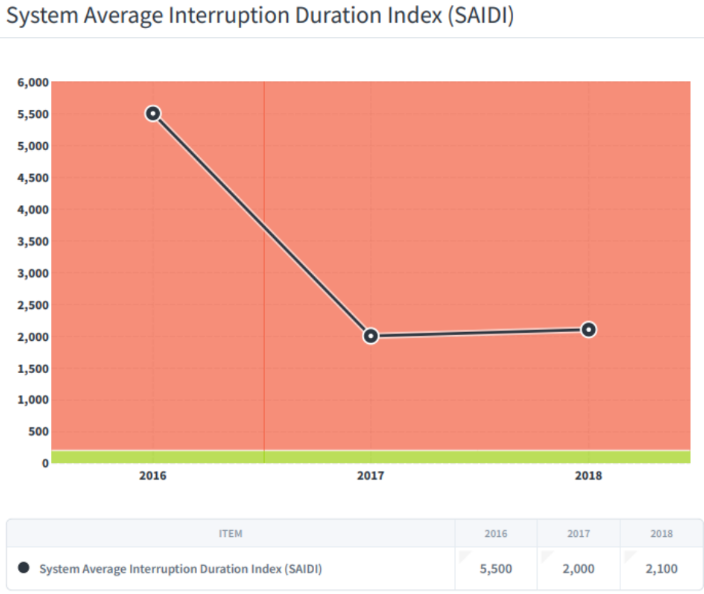
SAIDI indicates the average duration of power outages experienced by customers and is measured in customer minutes. The results are shown in Figure 5.5.1 as Planned and Unplanned outages that have resulted in power interruptions to customers. The categories based on the source of the interruption are, planned and unplanned generation events, and planned and unplanned network events. For the utilities not included in Figure 5.5.1, the data was either not provided or appears to be faulty or is well below the benchmark. The benchmark for Pacific Island utilities is for the total Planned and Unplanned SAIDI to be below 200 customer minutes.
Unplanned outages are calculated SAIDI minutes = (Total Customer Interruptions Duration Interrupted (cust hr) * 60 )/ (Average Number of Customers (connections)). The benchmark set by the PPA is 200 customer minutes. MEC’s data show that Dec 2020 had very high SAIDI over the benchmark limit, then decreased considerably in the following months to acceptable numbers.
3.4.2 System Average Interruption Frequency Index (SAIFI)
SAIFI indicates the average frequency of power interruptions experienced by customers over the fiscal year. For small island utilities the power interruptions to customers caused by generation events can be significant compared to distribution network events. Figure 5.5.2 shows the Planned and Unplanned SAIFI for each utility. Again, those utilities not included have either not provided data, or the data provided appears to be unreasonably high, or the index is well within the benchmark. The benchmark for Pacific Island utilities is for the total of Planned and Unplanned SAIFI to be below the average of 10 events per customer.
SAIFI data for MEC for 2016 to 2018 are illustrated in the graph above. SAIFI numbers are still high as compared to the benchmark.
3.5 Financial Indicators
3.5.1 Tariff Impact
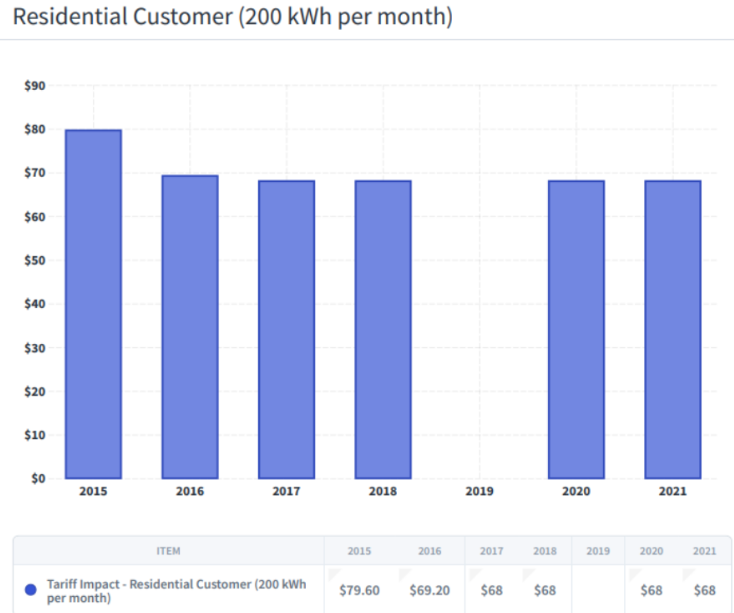
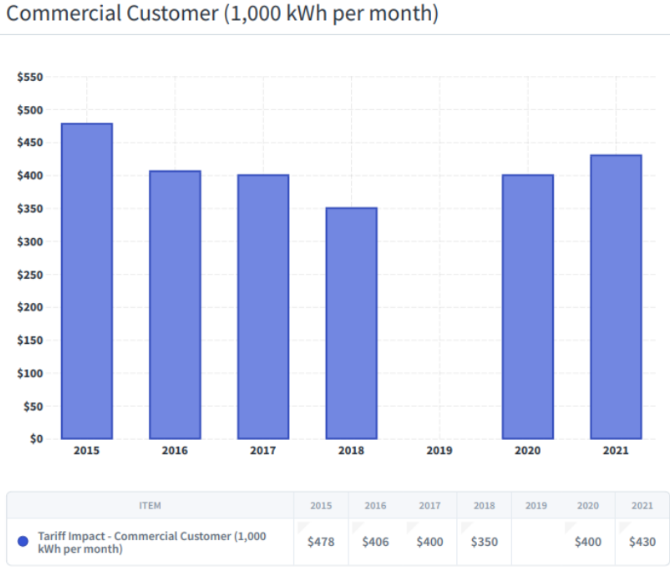
Conducting tariff analysis of Pacific utilities is highly complex due to the different tariff schedules and structures. This section therefore compares the impact of the tariff schedule applied to customers of
various categories. The monthly bills for a domestic or residential customers with a usage of 100 kWh and 200 kWh and 500 kWh is compared, ranked and graphed in ascending order. The same is done for a commercial customer with a usage of 1,000 and 5,000 kWh per month. For industrial customers the monthly electricity bill for a usage of 10,000 kWh per month is compared.
3.5.1.1 Residential Customer (200 kWh per month)
3.5.1.2 Commercial Customer (1,000 kWh per month)
3.5.2 Utility Cost Breakdown
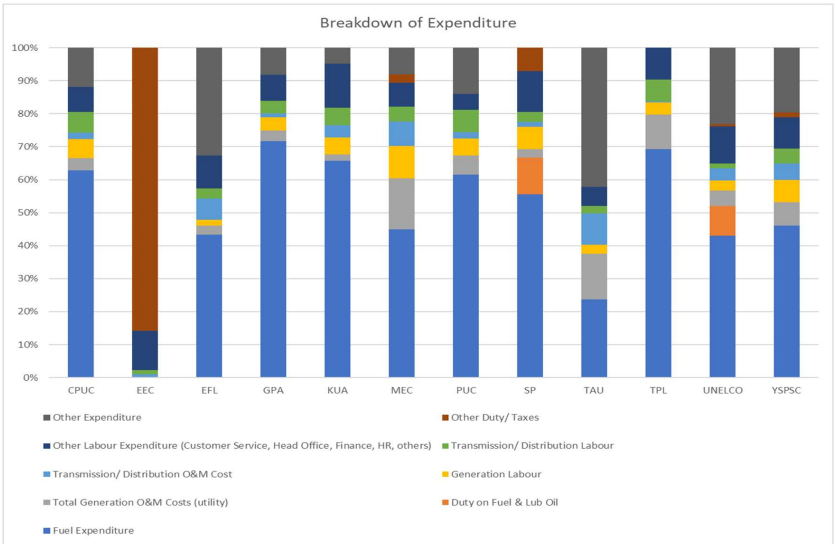
The cost categories for which information was collected included hydrocarbon-based fuel and lubrication costs, duty on fuel and lubricating oil, generation O&M, labour and deprecation, transmission and distribution O&M, labour and depreciation, and other overhead expenditure, duty, taxes and miscellaneous costs. The percentage contributions of each component are presented for the utilities that reported sufficient data in Figure 5.7.4 below. Fuel and lubricating oil expenditure is the largest component in the utilities cost structure ranging from 24% to 72%.
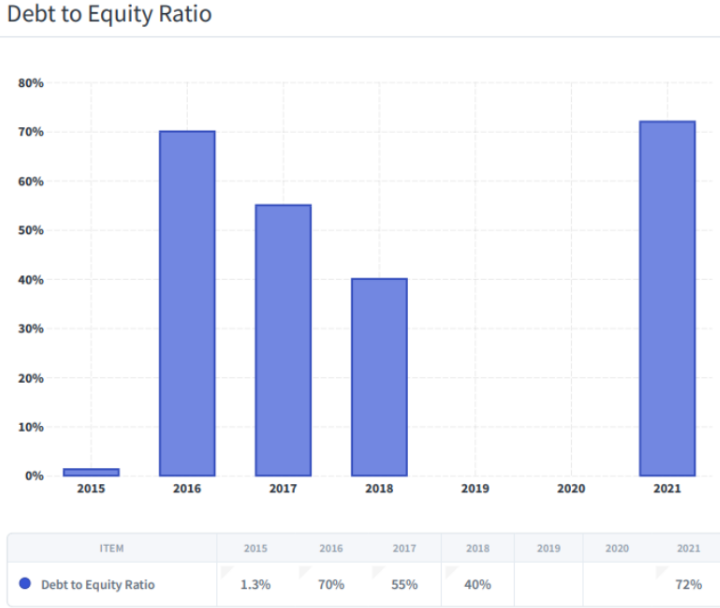
3.5.3 Debt to Equity Ratio
The indicator used for the level of utility debt is the ratio of total liabilities to equity, expressed as a percentage (debt / equity). Borrowing to improve services may be justified, but a high debt-to-equity ratio places a utility in a vulnerable position. Some smaller utilities do not have access to debt funding and rely on their government or grants from donors for large projects and so have no long-term debt obligations.
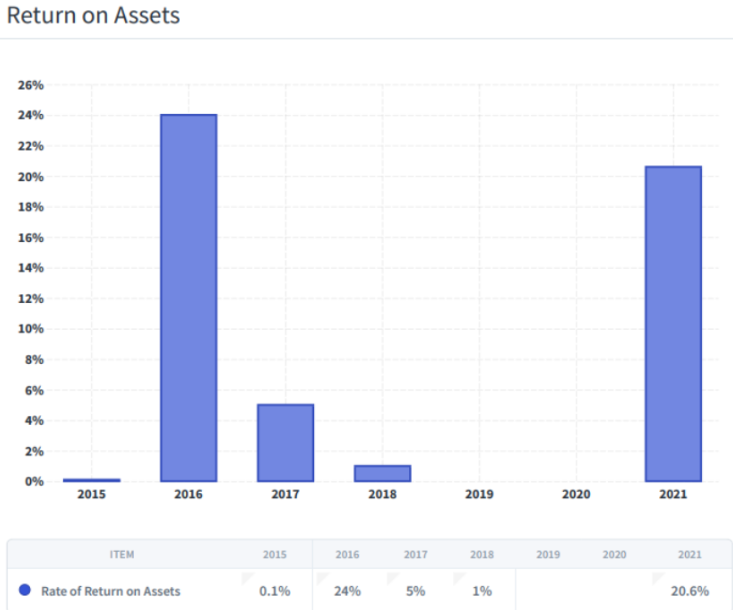
3.5.4 Return on Assets
The Rate of Return on Assets (RORA) is the return generated from the investment in the assets of the business. ROA indicates how efficient management is at using its assets to generate earnings. Pacific power utilities generally do not earn commercial rates of return.
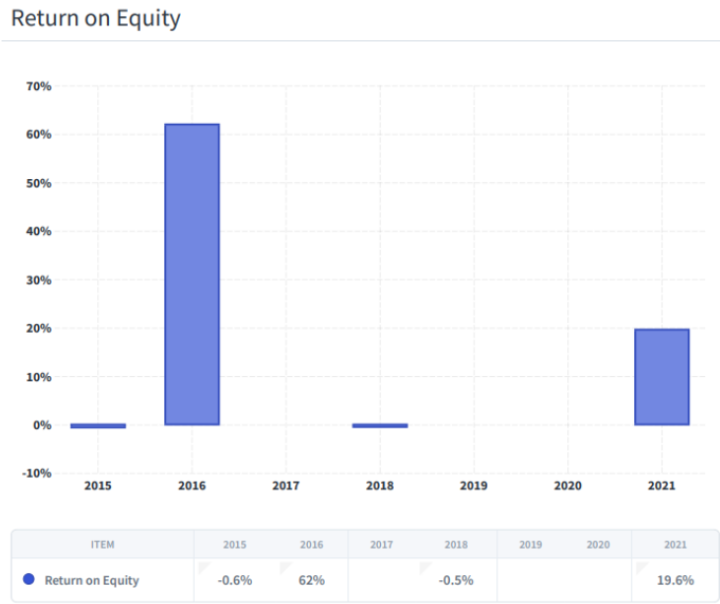
3.5.5 Return on Equity
ROE measures financial returns on owners’ funds invested. Results for ROE are shown in graph below.
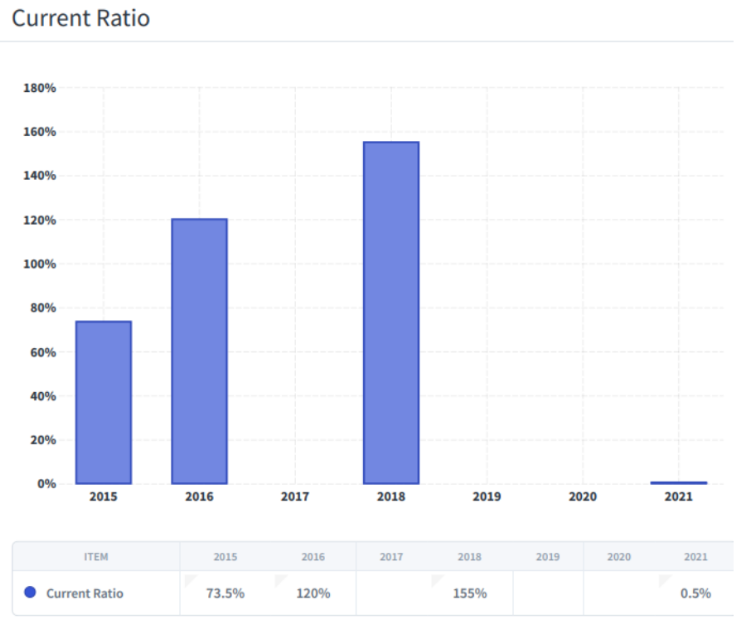
3.5.6 Current Ratio
The current ratio measures the ability of business to pay its creditors within the next 12 months, i.e., the ability of the utility to meet its current liabilities from current assets. A current ratio above 1 is desirable. A ratio below 1 implies that the utility is not able to cover for its current liabilities.
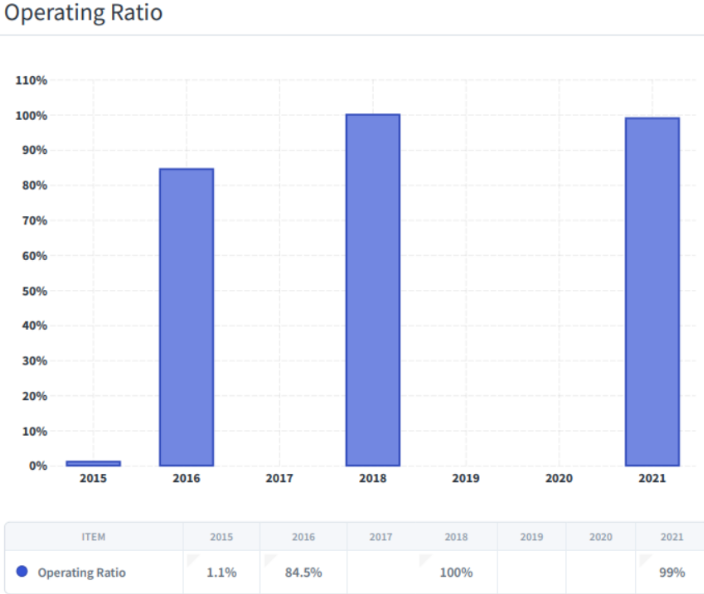
3.5.7 Operating Ratio
The operating ratio is a measure of how efficiently a business is operating, in this case, providing electricity service. It is determined by the Costs of Goods and Services (COGS) Including depreciation expenses divided by the revenue earned. An operating ratio below 100 indicates a profitable operation. An operating ratio above 100 indicates that it is costing an organisation more to provide the service than the revenue derived from the service.
3.5.8 Debtor Days
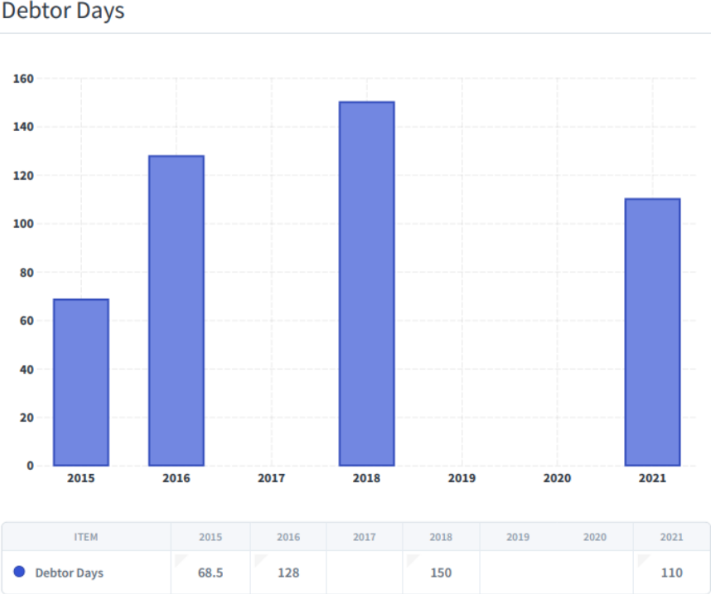
This indicator measures how long it takes, on average, for the utility to collect debts (receivables) owe to it. In 2021, the Pacific average was 95.14 days. In 2020 the average was 78.7 days and the average DD in 2019 was 88 days. The Pacific benchmark is set at 50 days
3.5.9 Operating Profit
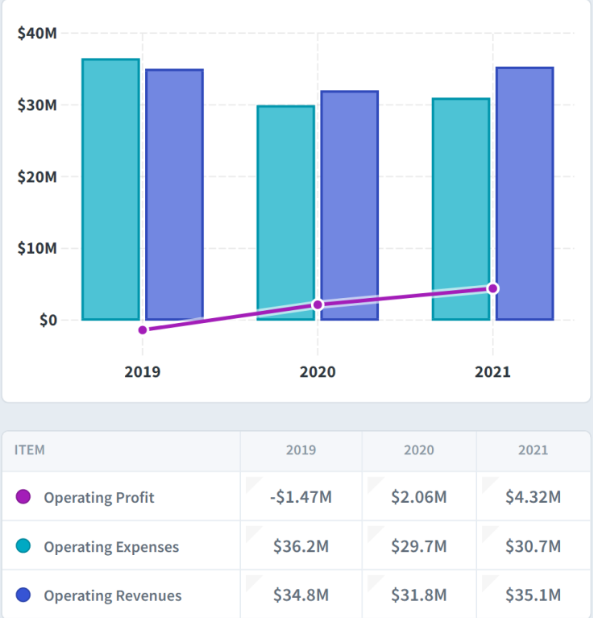
MEC’s Operating Profit increased from a deficit of $1.47 M in 2019 to increase in profit of $2M in 2020 and of $4.3 M in 2021. This shows that positive reforms of MEC have increased profit and cut down on expenses.
3.6 Human Resources & Safety Indicators
3.6.1 Lost Time Injury Duration Rate
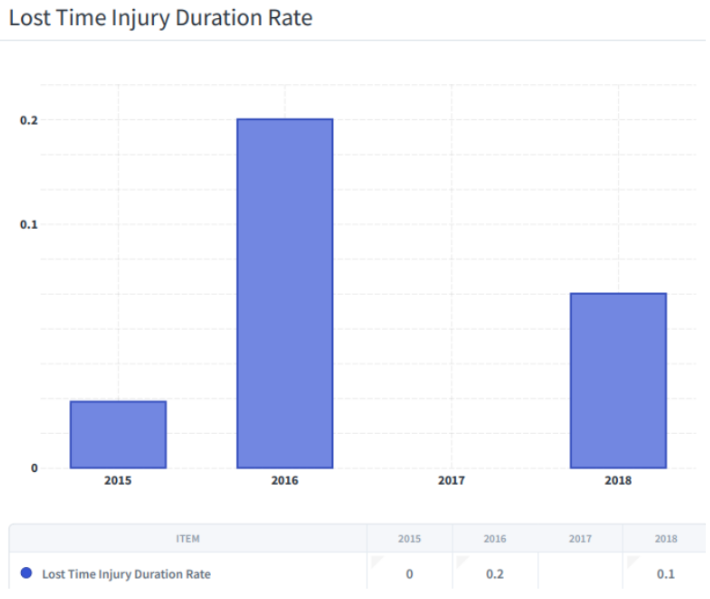
The average for 2021 FY was 0.08 days per FTE employee, compared to 0.58 days for 2020 FY. Unfortunately, only a limited of utilities responded making it difficult to draw any significant conclusions. This is an area that may need improvements in monitoring and recording of incidents.
3.6.2 Lost Time Injury Frequency Rate
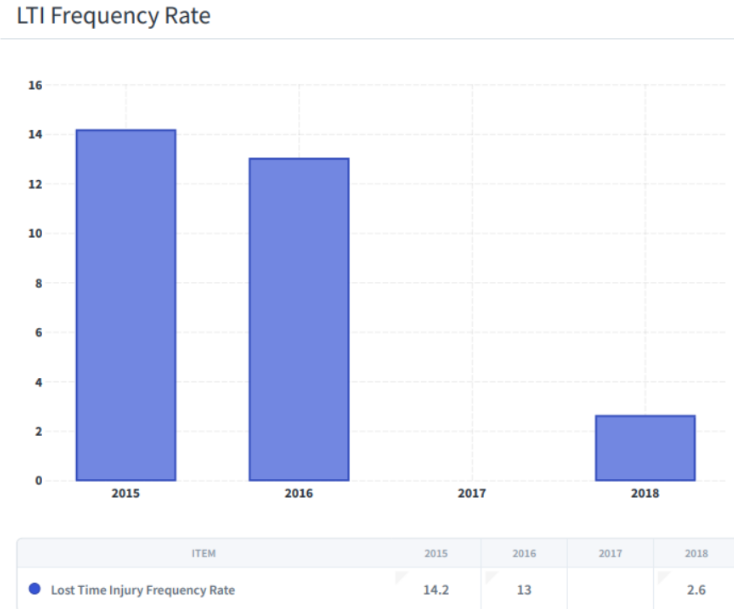
Only a limited number of utilities were able to provide sufficient data to determine the LTIFR.
3.6.3 Overall Labour Productivity
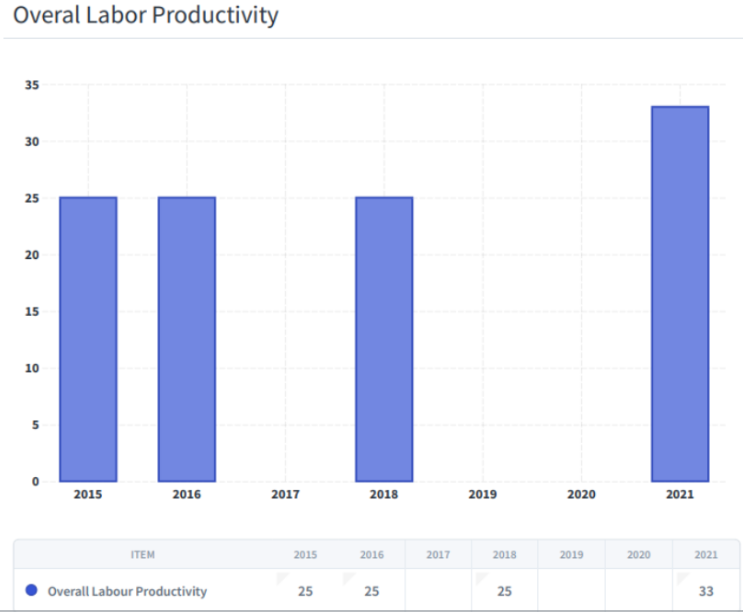
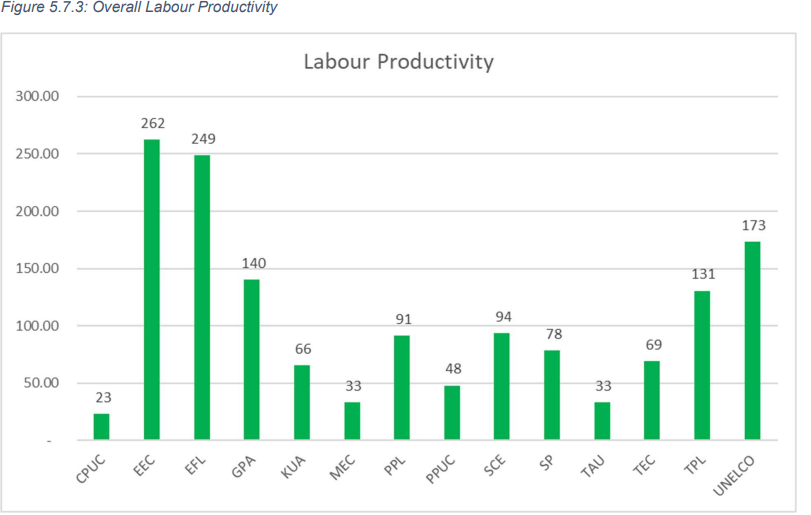
The Pacific average productivity in 2021 is 107 customers per Employee FTE. In 2020 the average was 123, and in 2019 FY, 94. A higher productivity is expected of larger utilities that operate with some economies of scale and are fully or partially privatise such as EEC, EFL and UNELCO MEC’s productivity increased from 25 in 2015 to 2018 to 33 in 2021
3.7 Overall Composite Indicator
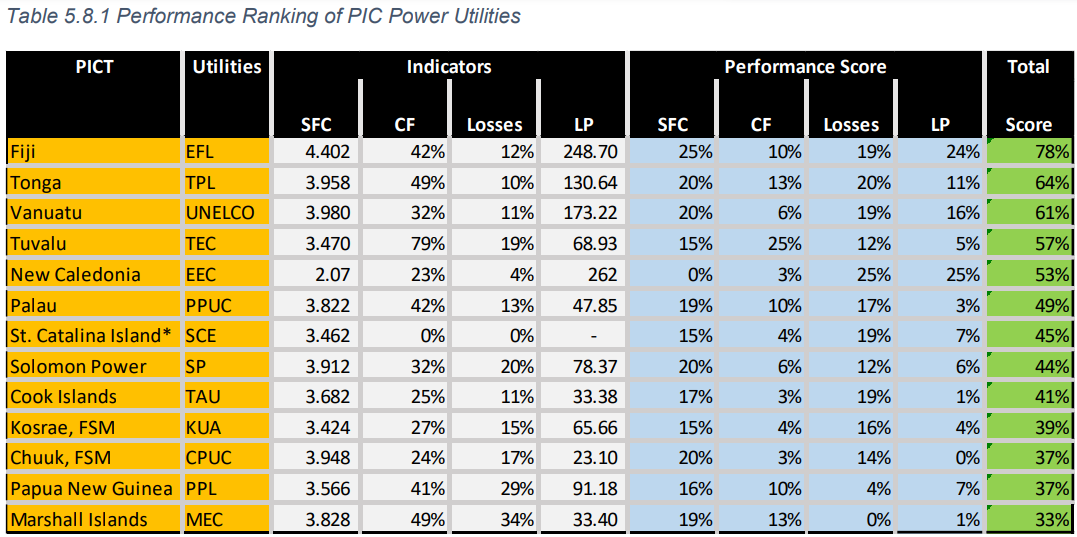
The overall composite indicator of utility performance was developed in 2011 to rank comparative performances between utilities. Where gaps existed in the data submitted by some utilities it was not possible to calculate an aggregate score. The overall composite indicator is a simple indicator that equally weights generation efficiency, capacity utilisation, system losses and overall labour productivity, as derived from quantitative scores on a scale up to 100%. Table 5.9.1 ranks the utilities for which the full data was provided. The composite technical indicator reflects the heavy reliance of power production on fossil fuels and its high impact on the production expenses. With the aggressive
pursuance of renewable energy production this indicator that is skewed to favour efficient fossil fuel production, will become less relevant going forward.
Performance Ranking of PIC Power Utilities in 2021
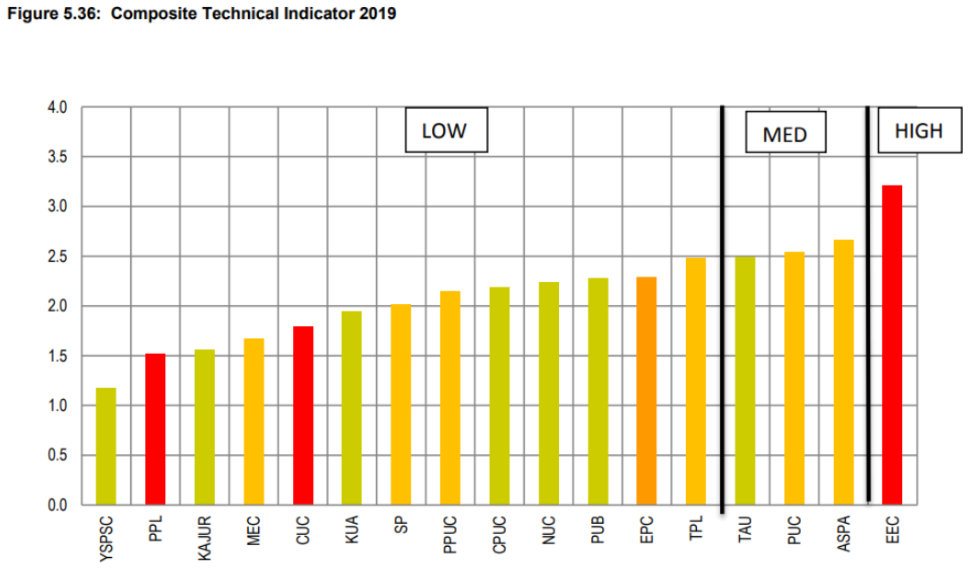
In 2021, MEC’s score was 33%, performed low compared to other Pacific Power Utilities. Low score is attributed to high system losses, and low overall labor productivity.
The overall composite indicator was scaled with a maximum score of 4.0 in the past benchmarking reports up to 2019, it’s the same as percentage but with a maximum score of 4.0 instead of 100%. It’s a simple indicator that equally weights generation efficiency, capacity utilisation, system losses and overall labour productivity, as derived from quantitative scores on a scale up to 4.0. Overall, this was considered to be a valid assessment of technical performance.
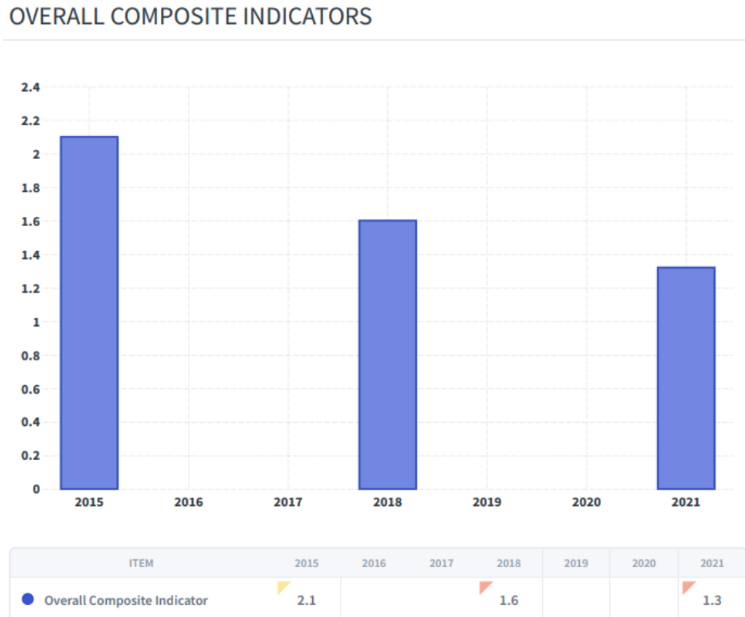
MEC’s composite score for three years assessed for 2015 was low 2.1, lower in 2018 with a score of 1.6 and a score of 1.3 in 2021.
